Here we address the first time our stock price model for Aon Corporation (AON) which is a company from financial sector and is engaged in risk management and insurance and reinsurance brokerage. The model has been obtained using our concept of share pricing as a decomposition of a share price into a weighted sum of two consumer price indices. The intuition is simple; a faster growth in the CPI related to the share price (e.g. energy consumer price for energy companies) relative to some independent and dynamic reference should be manifested in a higher pricing power for the company. Our model seeks for the defining CPI and the reference. Ultimately, our goal is to test the underlying concept and to estimate time lags and coefficients for AON.
We have borrowed the time series of monthly closing prices of AON from Yahoo.com and the relevant (seasonally not adjusted) CPI estimates through January 2012 are published by the BLS. The evolution of AON share price is defined by the consumer price index of tenants' and household insurance (THI) and the index of recreation (R). The defining time lags are as follows: the THI index has no lead and the R index leads by 4 months. The relevant best-fit model for AON(t) is as follows:
AON(t) = -2.35THI(t-0) – 3.21(t-4) + 9.64R(t-1990) + 503.25, February 2012
where AON(t) is the AON share price in U.S. dollars, t is calendar time. Figure 1 displays the evolution of both defining indices since 2002. The tenants' and household insurance index with zero months lead makes the model a sound one since AON deals with insurance.
Figure 2 depicts the high and low monthly prices for an AON share together with the predicted and measured monthly closing prices (adjusted for dividends and splits). The predicted prices are well within the bounds of the share price uncertainty. The model residual error is shown in Figure 3 with the standard deviation between July 2003 and January 2012 of $2.54.
Both CPIs have negative influence on the share price. Therefore, the price should decrease when the indices grow fast. Fortunately, the index of recreation has been declining since 2009 to compensate the rising prices of tenants' and household insurance. We xpect the THI index to decelerate in the near future and AON share price to increase slightly in 2012.
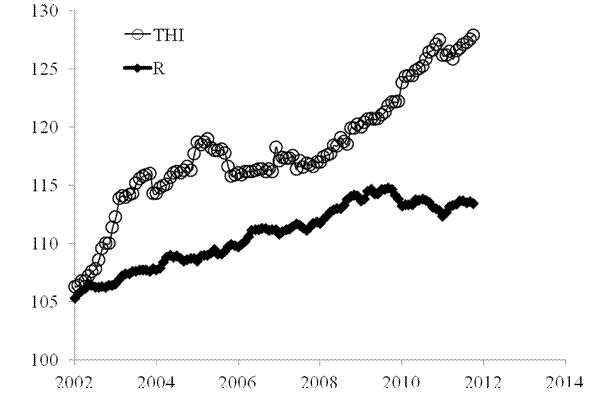
Figure 1. The evolution of the index of tenants' and household insurance (THI) and the index of recreation (R).
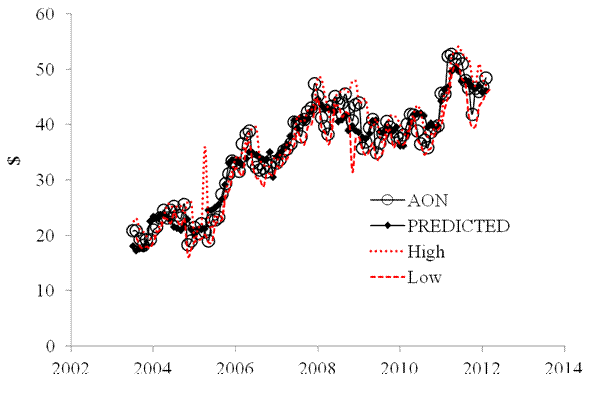
Figure 2. Observed and predicted AON share prices.

Figure 3. The model residual error: stdev=$2.54.
No comments:
Post a Comment